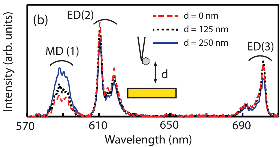
Europium ions emit light by fluorescence at several wavelengths in the visible. Emission lines can come from an electric dipolar transition (ED) or a magnetic one (MD). The polarization of the emitted light is different according to the nature of the transitions. Therefore, the emission spectrum of an europium doped nanocrystal can be modified as a function of its distance to a mirror.
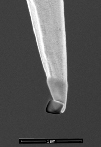
To observe this effect, we glued a 200nm-sized europium doped fluoride nanocrystal at the end of a sharp tip and recorded fluorescence spectra as a function of the distance between the tip and the surface. As seen in Fig. 1, when the fluorescence of the MD transition increases, the intensity of the ED one decreases. The color of the nanocrystal slightly changes as a function of its distance to the surface.
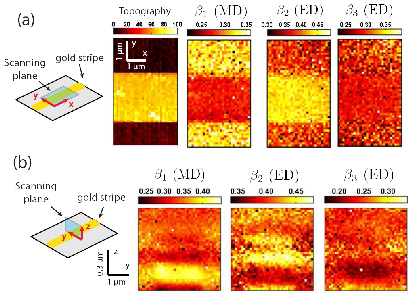
We performed scans on a reflective gold stripe in 3 dimensions and recorded the intensity of each fluorescence line. In collaboration with A. Cazé and R. Carminati, we calculated the relative importance of the MD and ED lines and showed that the technique permits to map the electric and magnetic radiative parts of the local optical density of states (see Fig. 2).
This effect is interesting because the color changes of europium ions may have applications in the development of sensors. Also, mapping the magnetic part of electromagnetic density of states may be of importance for characterizing the near-field properties of nano-antenna and matematerials.
 ESPCI web site