Reflectometry
 Reflectometry is a technique which relies on the local change of reflection
coefficient in a heated sample. In such, requirements on sample surface
finish place conditions on what pretreatment may be required. The technique
is more complex than direct IR radiometry in that in addition to a modulated
source it requires a probe beam, which is reflected off of the sample
surface. The relative change of the sample reflectance due to the
temperature change in the typical linear case is given by
Reflectometry is a technique which relies on the local change of reflection
coefficient in a heated sample. In such, requirements on sample surface
finish place conditions on what pretreatment may be required. The technique
is more complex than direct IR radiometry in that in addition to a modulated
source it requires a probe beam, which is reflected off of the sample
surface. The relative change of the sample reflectance due to the
temperature change in the typical linear case is given by
Delta R/R=(1/R)(dR/dT)Delta T
The temperature coefficient dR/dT depends on probe wavelength and
the sample material. By comparing with known values, and measuring
Delta R/R, typically on the order of 10-6, we can deduce Delta T
, the temperature variation, which is on the order of
10-2. This carries information about the local temperature parameters
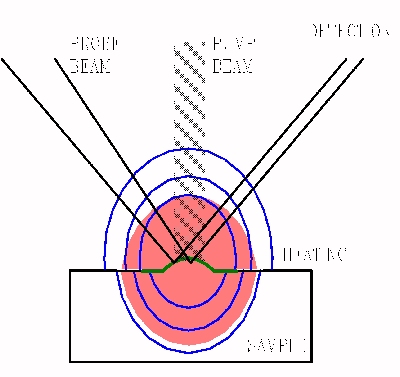
of the sample such as the thermal diffusivity D. This heated interaction
volume can vary with pulsation variation, and is shown right.
With this method we may draw a temperature map on a micronic scale, and so
analyze complicated samples such as laser diode facets and electronic
devices. We may also measure thermal diffusivity on a microscopic scale in
granulated samples such as AlN and Al2O3 or thermal
barriers in Fe sintered samples.
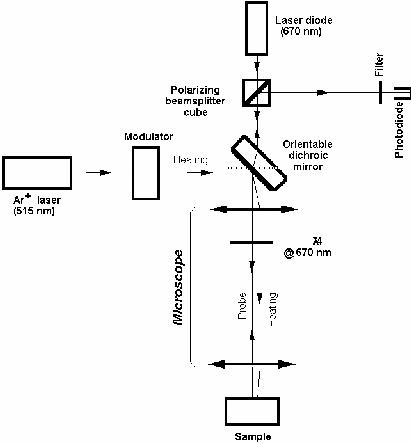 Our experimental setup is built up under an optical microscope, with a
dichroic mirror inserted to direct the incoming pump laser (typically an
Ar+) down onto the sample, which is mounted on a computerized translation
stage. The probe beam, typically a visible diode laser, traverses the
microscope optical chain, and is reflected back through the microscope, and
directed by a beam splitter onto a photodiode. In order to optimize thermal
map resolution, modulation frequencies upto a few MHz are used. A diagram of
the experimental setup is shown on the left.
Our experimental setup is built up under an optical microscope, with a
dichroic mirror inserted to direct the incoming pump laser (typically an
Ar+) down onto the sample, which is mounted on a computerized translation
stage. The probe beam, typically a visible diode laser, traverses the
microscope optical chain, and is reflected back through the microscope, and
directed by a beam splitter onto a photodiode. In order to optimize thermal
map resolution, modulation frequencies upto a few MHz are used. A diagram of
the experimental setup is shown on the left.
Thermal properties may be mapped out by carrying out the measurement over a
grid of points on the sample surface. As the optical characteristics of the
sample are important for the reflection of the probe beam, the geometry may
be changed slightly to provide scanning of the pump beam. In this way, the
sample surface need be prepared only at the probe location.
A measurement on
a gold sample with a scratch is shown below. On the left, the
scratch is clearly visible in the the reflectance values. On the right, the
phase pattern, related to the spherical shape of the heating spot is shown
as a contour plot, with equally spaced circles corresponding to equal phase
increments. The graduations, visible on the edges of the plots, are in
micrometers.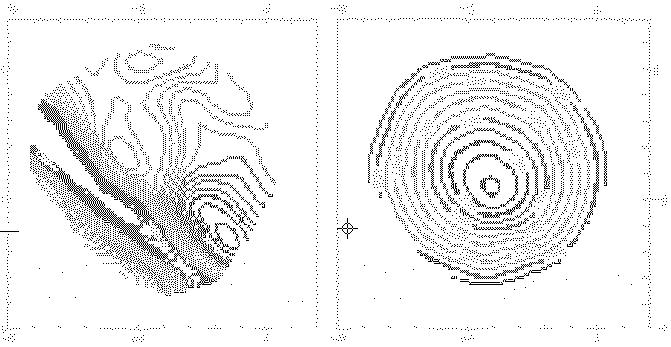
Furthermore, nonlinear effects such as temperature dependance of the thermal
diffusivity or additional effects such as free photocreated carrier
diffusion may be studied by including their influence in the reflectance
equation. For instance, should we wish to study the influence of carriers
(electron or hole) in silicon samples, we include a term for the change of
carrier density vis:
Delta R/R=(1/R)(dR/dT)Delta T+(1/R)(dR/dN)Delta N
The carrier density, inferred from the carrier diffusion equation, which can
be solved in the same way as the thermal diffusion equation, acts as a
source term in the heat diffusion equation. Typical values of the
contributions are dR/dT=10-4 and dR/dN=10-7
and we note that a 180° phase difference is to be expected in the
contribution of these two terms. With this method, the level of implantation
has been determined in different samples, and electronic
diffusivity coefficients determined unambiguously.
Return to the top/
Retour ŕ la page principale